Browsers cannot handle large volume data and with the diverse nature of data generated for analysis, it is now turning out that browser based visualization is something that is inevitable. We are using visualization techniques along with machine learning algorithms to manage the data volume and using appropriate visualization techniques to plot the data. It allows users to work interactively with the charts so that different views based on different attributes can be applied by mere drag and drop.e.
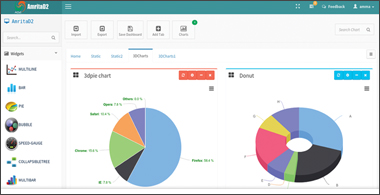
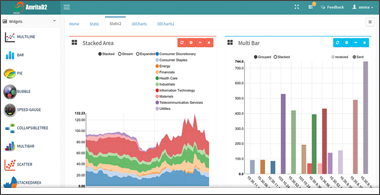
TD2 allows users to build dynamic interactive dashboards with support for multiple charts pertaining to the same dataset within a single page. Various types of interactive capabilities are built into the tool to make sense out of large data heaps.
TD2 is well integrated with ABDF. Processed data flows smoothly from ABDF to TD2 through single sign on based authentication. This will ensure that users could traverse from ABDF to TD2 for databrowsing and visualization. Besides this TD2 can also be deployed as a stand alone tool where in which data can be directly uploaded or pointed to via TD2 UI and analyzed directly. Aggregation, filtering,roll ups, slicing and dicing, etc., can be done directly via TD2 browser interface.Streaming data from IoT devices can also be captured directly in TD2 via MQTT,ZMQ and/or Kafka which are the message queues supported by the tool.
Some Of Its Features
For further details: www.amritad2.in
TD2 UI
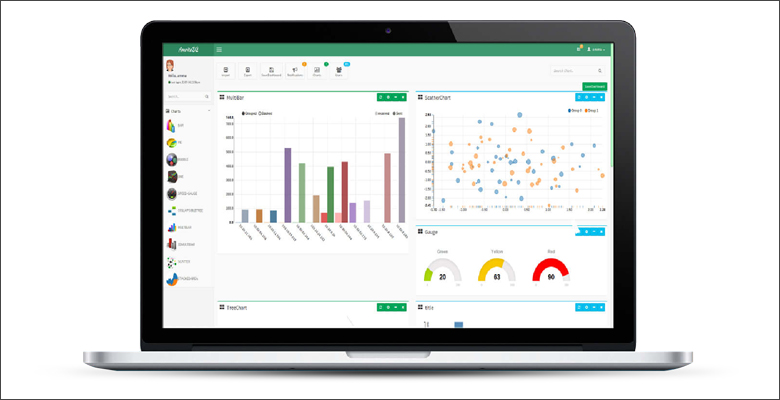
TRANQUILITY DYNAMIC DASHBOARD
Technologies Used